
Numerical Reasoning Tests – All You Need to Know in 2026
Updated July 28, 2024


What Is a Numerical Reasoning Test?
Numerical aptitude tests (also known as numerical ability tests) evaluate how well a person works with numbers.
This may include interpreting graphs and tables or using math and algebra to solve calculations.
Numerical reasoning tests are a specific type of numerical test that will assess your ability to use numbers in a logical and rational way.

Numerical aptitude tests are often used by employers as part of the recruitment process and are often part of a wider psychometric assessment which may include verbal reasoning or spatial ability tests.
Why Do Employers Use Numerical Reasoning Tests?
Numerical aptitude tests are popular with employers because many jobs require you to work with numbers at least some of the time.
If you are applying for a job that involves working with figures on a day-to-day basis, the employer will regard your numerical ability as a valuable predictor of your performance on the job.
In some career fields, numerical ability holds particular importance; in architecture or accounting, for example, being off on even one calculation can be extremely costly and can even be dangerous.
The key industries that require numerical testing as part of their application processes are:
- Accountancy
- Engineering
- Architecture
- Banking
- The military
- Sales
- Marketing
What to Expect on a Numerical Reasoning Test
Numerical aptitude tests may be administered on paper or online.
The questions are almost always presented in multiple-choice format and may become more difficult as you progress through the test.
Usually, calculators are not allowed, although they may be permitted on certain question types. Make sure you read the instructions you have been given to find out whether you need to bring a calculator to the test.
The duration of any numerical aptitude test you are asked to take will depend on several factors including how many other tests you are taking on the day. However, most tests last about 30 to 40 minutes and have about 30 to 40 questions.
This will mean that you will be expected to work quickly, having only about one minute to answer each question.
Numerical aptitude tests from different suppliers vary in both the number and difficulty of the questions that they contain and there are several hundred of these tests on the market.
However, the questions used in these tests can be classified into four basic types:
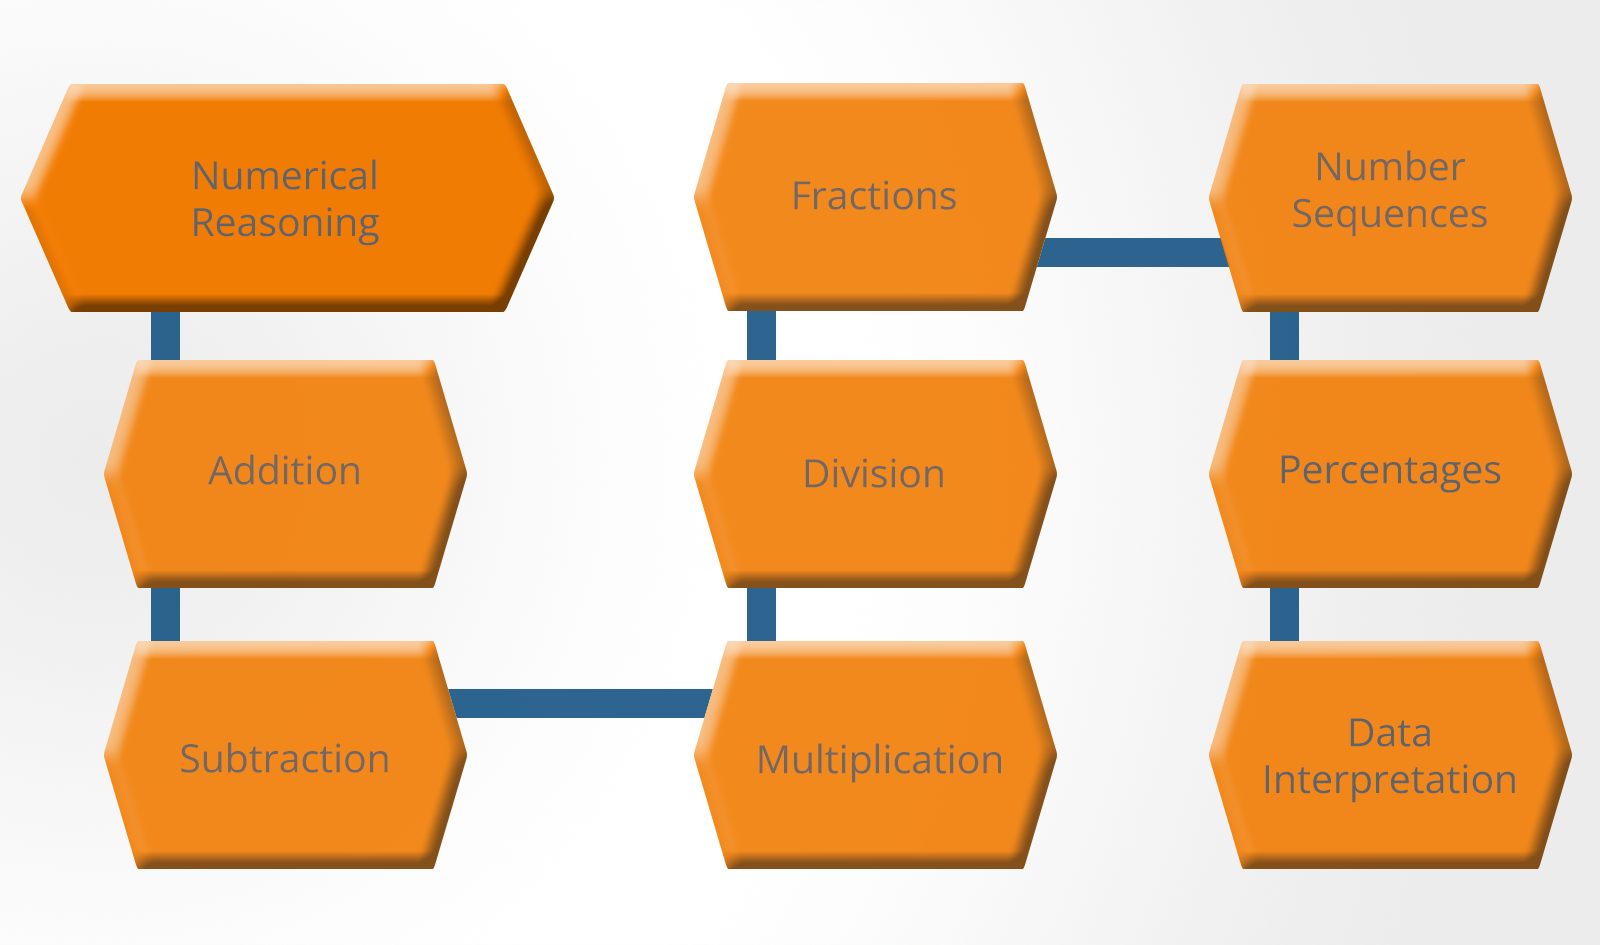
- Numerical computation – You will be tested on your basic arithmetic (addition, subtraction multiplication, division, percentages, powers, fractions, etc).
- Numerical estimation – You will need to quickly estimate the answer to simple arithmetic problems.
- Numerical reasoning – You are presented with some data and questions but the methods required to answer the questions are not specified.
- Data interpretation – These tests commonly use line graphs, scatter-plots, pie charts and tables which you need to understand and manipulate to answer the questions.
For certain jobs, you may also come across data checking questions that require you to identify errors in data.

Prepare for Any Job Assessment Test with TestHQ
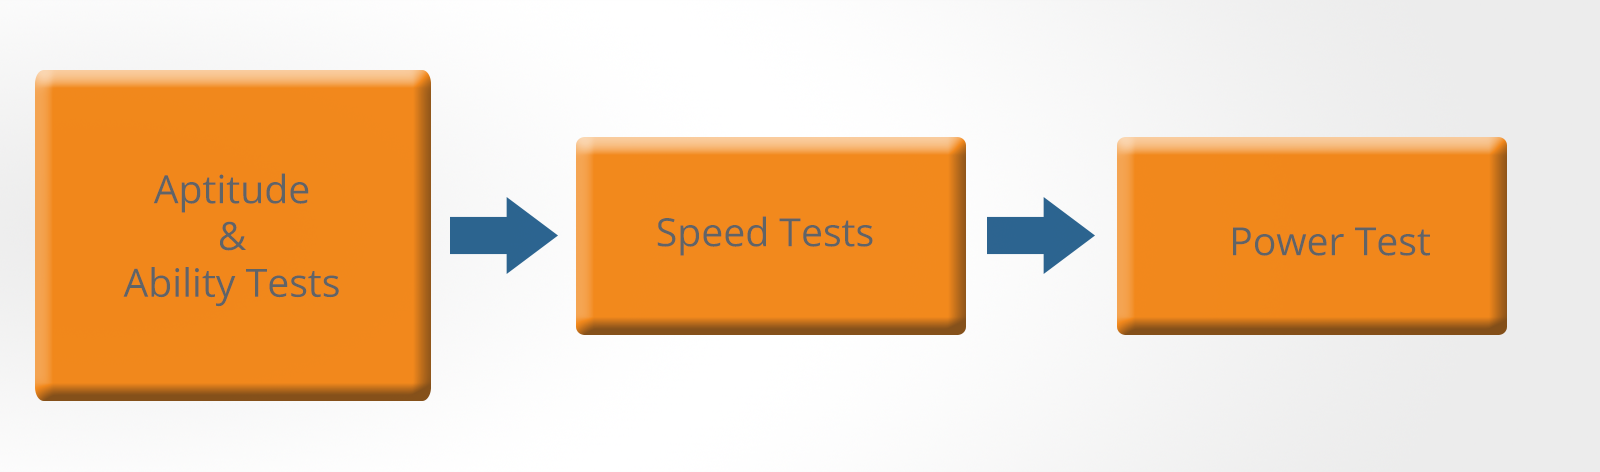
Numerical tests are either speed tests or power tests:
-
Numerical computation and numerical estimation are typically speed questions. This means that the test taker is put under pressure by a very tight time limit. To score well on these questions, you will need to be able to make quick and accurate calculations without using a calculator. You will usually not be expected to finish the test but you will be assessed on the number of correct answers you have achieved.
-
Numerical reasoning and data interpretation are usually known as power tests. Here you probably won’t be expected to get all of the answers correct, even with unlimited time. You will usually be given sufficient time to complete the questions.
Numerical Reasoning Test Practice Questions
Numerical Computation
These questions test your ability to use the basic principles of arithmetic. Such as:
- Addition
- Subtraction
- Multiplication
- Division
They may also use mathematical terms and methods such as:
- Decimals
- Percentages
- Ratios
- Roots
- Fractions
- Powers
- Exponents
These questions are not designed to test your reasoning abilities.
To score well on these questions, you will simply need to make quick and accurate calculations.
These questions are directly applicable to many administrative and clerical jobs but can also appear as a component of graduate and managerial tests.
The speed at which you can answer these questions is the critical measure as most people could achieve a very high score given unlimited time in which to answer.
You can, therefore, expect 25 to 35 questions in 20 to 30 minutes.
Prepare for Any Job Assessment Test with TestHQ
1. 139 + 235 = ?
A) 372
B) 374
C) 376
D) 437
2. 139 – 235 = ?
A) –69
B) 96
C) 98
D) –96
3. 5 x 16 = ?
A) 80
B) 86
C) 88
D) 78
For more on how to calculate fractions and how to calculate ratios see our dedicated articles.
Prepare for Any Job Assessment Test with TestHQ
Numerical Estimation
These questions test your ability to make quick estimates of the answers to fairly straightforward numerical questions.
To score well on these questions, you will need to make quick approximations of the answer.
You must avoid the trap of working out the answer exactly, which will take up too much time and prevent you from answering enough questions to get a good score.
Numerical estimation is key in many craft and technical jobs where the ability to quickly and accurately estimate material quantities is essential.
However, the ability to make quick estimates is a useful skill to have even if you are sitting a graduate or professional-level test as it will enable you to roughly check your answers to data interpretation questions.
The speed at which you can answer these questions is the critical measure as most people could achieve a very high score given unlimited time in which to answer.
You can, therefore, expect 25–35 questions in 10 minutes or so.
Even though numerical estimation questions appear straightforward, it can take some time to develop the optimum compromise between speed and accuracy.
Before you attempt to answer each question, look at the range of answers available and ask yourself how accurate your estimate needs to be.
For example, is an order of magnitude sufficient or does the answer need to be worked out to the nearest whole number?
1. 347 + 198 = ?
A) 650
B) 550
C) 580
D) 590
E) 600
2. 3,509 + 3,492 = ?
A) 7,000
B) 7,200
C) 7,100
D) 7,250
E) 6,950
3. 989 + 413 + 498 = ?
A) 2,600
B) 900
C) 1,100
D) 1,900
E) 3,200
Numerical Reasoning
Numerical reasoning tests assess your ability to use numbers in a logical and rational way.
You will need to interpret the information provided and then apply the appropriate logic to answer the questions.
In other words, you need to work out how to get the answer rather than what calculations to apply.
These questions require only a basic level of education to complete and are therefore measuring numerical reasoning ability rather than educational achievement.
The questions measure your understanding of number series, numerical transformations, the relationships between numbers and your ability to perform numerical calculations.
They also include text-based questions where a mathematical problem is posed in words and your task is to apply the necessary logic to find the answer.
Sometimes, the questions are designed to approximate the type of reasoning required in the workplace.
You will usually be allowed to use a calculator for these types of questions and investing in one which can handle fractions and percentages is a good idea.
You should expect around 15 to 20 questions in 20 to 30 minutes.
If you need to prepare for a number of different employment tests and want to outsmart the competition, choose a Premium Membership from TestHQ.
You will get access to three PrepPacks of your choice, from a database that covers all the major test providers and employers and tailored profession packs.
Prepare for Any Job Assessment Test with TestHQ
1. Anna and John both drive to their new home 400 miles away. Anna drives the family car at an average speed of 60 mph. John drives the removal truck at an average speed of 50 mph. During the journey, Anna stops for a total of 1 hour and 20 minutes, John stops for half as long. What is the difference in minutes between their arrival times?
A) 60
B) 55
C) 40
D) 90
E) 80
Prepare for Any Job Assessment Test with TestHQ
Download Practice Numerical Reasoning Tests
Number Sequences
These reasoning questions require you to find the missing number in a sequence of numbers.
This missing number may be at the beginning or middle but is usually at the end.
To solve these number sequence questions efficiently, you should first check the relationship between the numbers themselves, looking for some simple arithmetic relationship.
Then, look at the intervals between the numbers and see if there is a relationship there. If not, and particularly if there are more than four numbers visible, then there may be two number sequences interleaved.
You will occasionally find multiplication, division or powers used in these sequences, but test designers tend to avoid them as these operations soon lead to large numbers which are difficult to work out without a calculator.
1. Find the next number in the series:
4, 8, 16, 32, ?
A) 48
B) 64
C) 40
D) 46
2. Find the missing number in the series:
54, 49, ?, 39, 34
A) 47
B) 44
C) 45
D) 46
Number sequence questions can be quite simple like the examples above. However, you will often see more complex questions where the intervals between the numbers are the key to the sequence:
3. Find the next number in the series:
3, 6, 11, 18, —
A) 30
B) 22
C) 27
D) 29
These number sequences usually consist of four visible numbers plus one missing number. This is because the test designer needs to produce a sequence into which only one number will fit.
The need to avoid any ambiguity means that if the number sequence relies on a more complex pattern, there will need to be more visible numbers.
For example:
4. Find the missing number in the series:
4, 3, 5, 9, 12, 17, ?
A) 32
B) 30
C) 24
D) 26
5. Find the two missing numbers in the series (choose two answers):
1, ?, 4, 7, 7, 8, 10, 9, ?
A) 6
B) 3
C) 11
D) 13
Letter of the Alphabet as Numbers
Another type of sequence question that appears in reasoning tests involves the substitution of letters of the alphabet for numbers.
For example, A = 1, B = 2, etc.
It may seem strange to consider these as numerical reasoning questions but they actually work in the same way once you have changed them back into numbers.
Because arithmetic operations cannot be performed on letters, there is less room for ambiguity in these questions.
This means that interleaved sequences can be used with fewer visible letters than in questions that use numbers.
It is implicit in these alphabetic sequence questions that the sequence loops back around and starts again. It is important to recognize this as it is not usually stated explicitly – you are just expected to know it.
If you see more than one of these questions in a test, it is almost certainly worth taking the time to write out the letters of the alphabet with their ordinal numbers underneath.

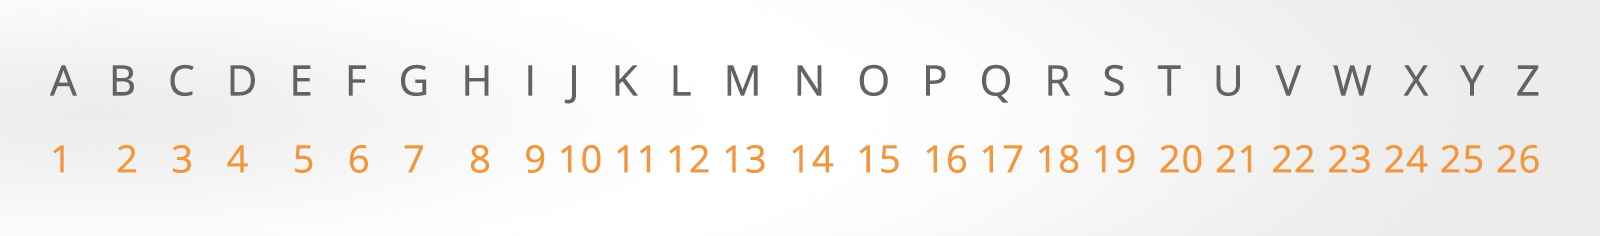
You can then treat these questions in a similar way to number sequence questions. This can save a lot of time overall and avoid simple mistakes.
1. Find the next letter in the series:
B, E, H, K, ?
i) L
ii) M
iii) N
iv) O
Data Interpretation
Most management and supervisory jobs require you to interpret data presented in charts, tables and graphs to make day-to-day decisions.
If you are applying for a job that involves the analysis of or decision-making based on numerical data then you can expect to have to answer data interpretation questions.
These tests commonly use:
- Pie charts
- Line graphs
- Scatter-plots
- Tables of data
Data interpretation questions will often use very specific illustrations; for example, the question may present financial data or use information technology jargon.
However, an understanding of these areas is not required to answer the question.
The more complex questions may show the data in one format (for example, a table) and a subset of this data in another format (for example, a pie chart).
To answer the questions, you need to be able to cross-reference these two elements logically.
Data interpretation problems usually require two basic steps:
- First, you have to read a chart or graph to obtain certain information.
- Then you have to apply or manipulate the information to obtain an answer.
These types of questions are commonly used in graduate and managerial selection and you can usually expect 20 to 25 questions in 20 to 30 minutes.

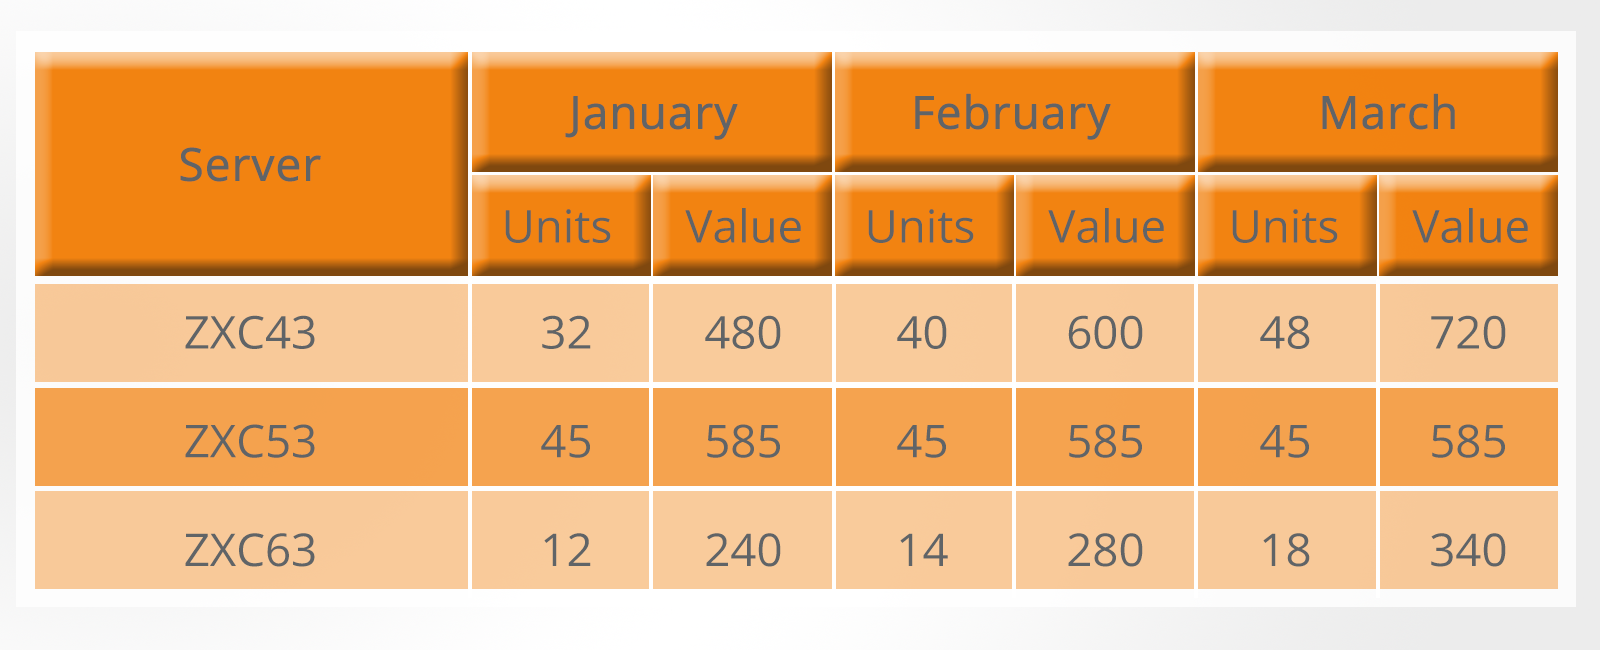
1. In which month was the sales value highest?
A) January
B) February
C) March
2. What is the unit cost of server type ZXC53?
A) 12
B) 13
C) 14
3. How many ZXC43 units could be expected to sell in April?
A) 56
B) 58
C) 60
4. Which server had its unit price changed in March?
A) ZXC43
B) ZXC53
C) ZXC63
Download Practice Data Interpretation Tests
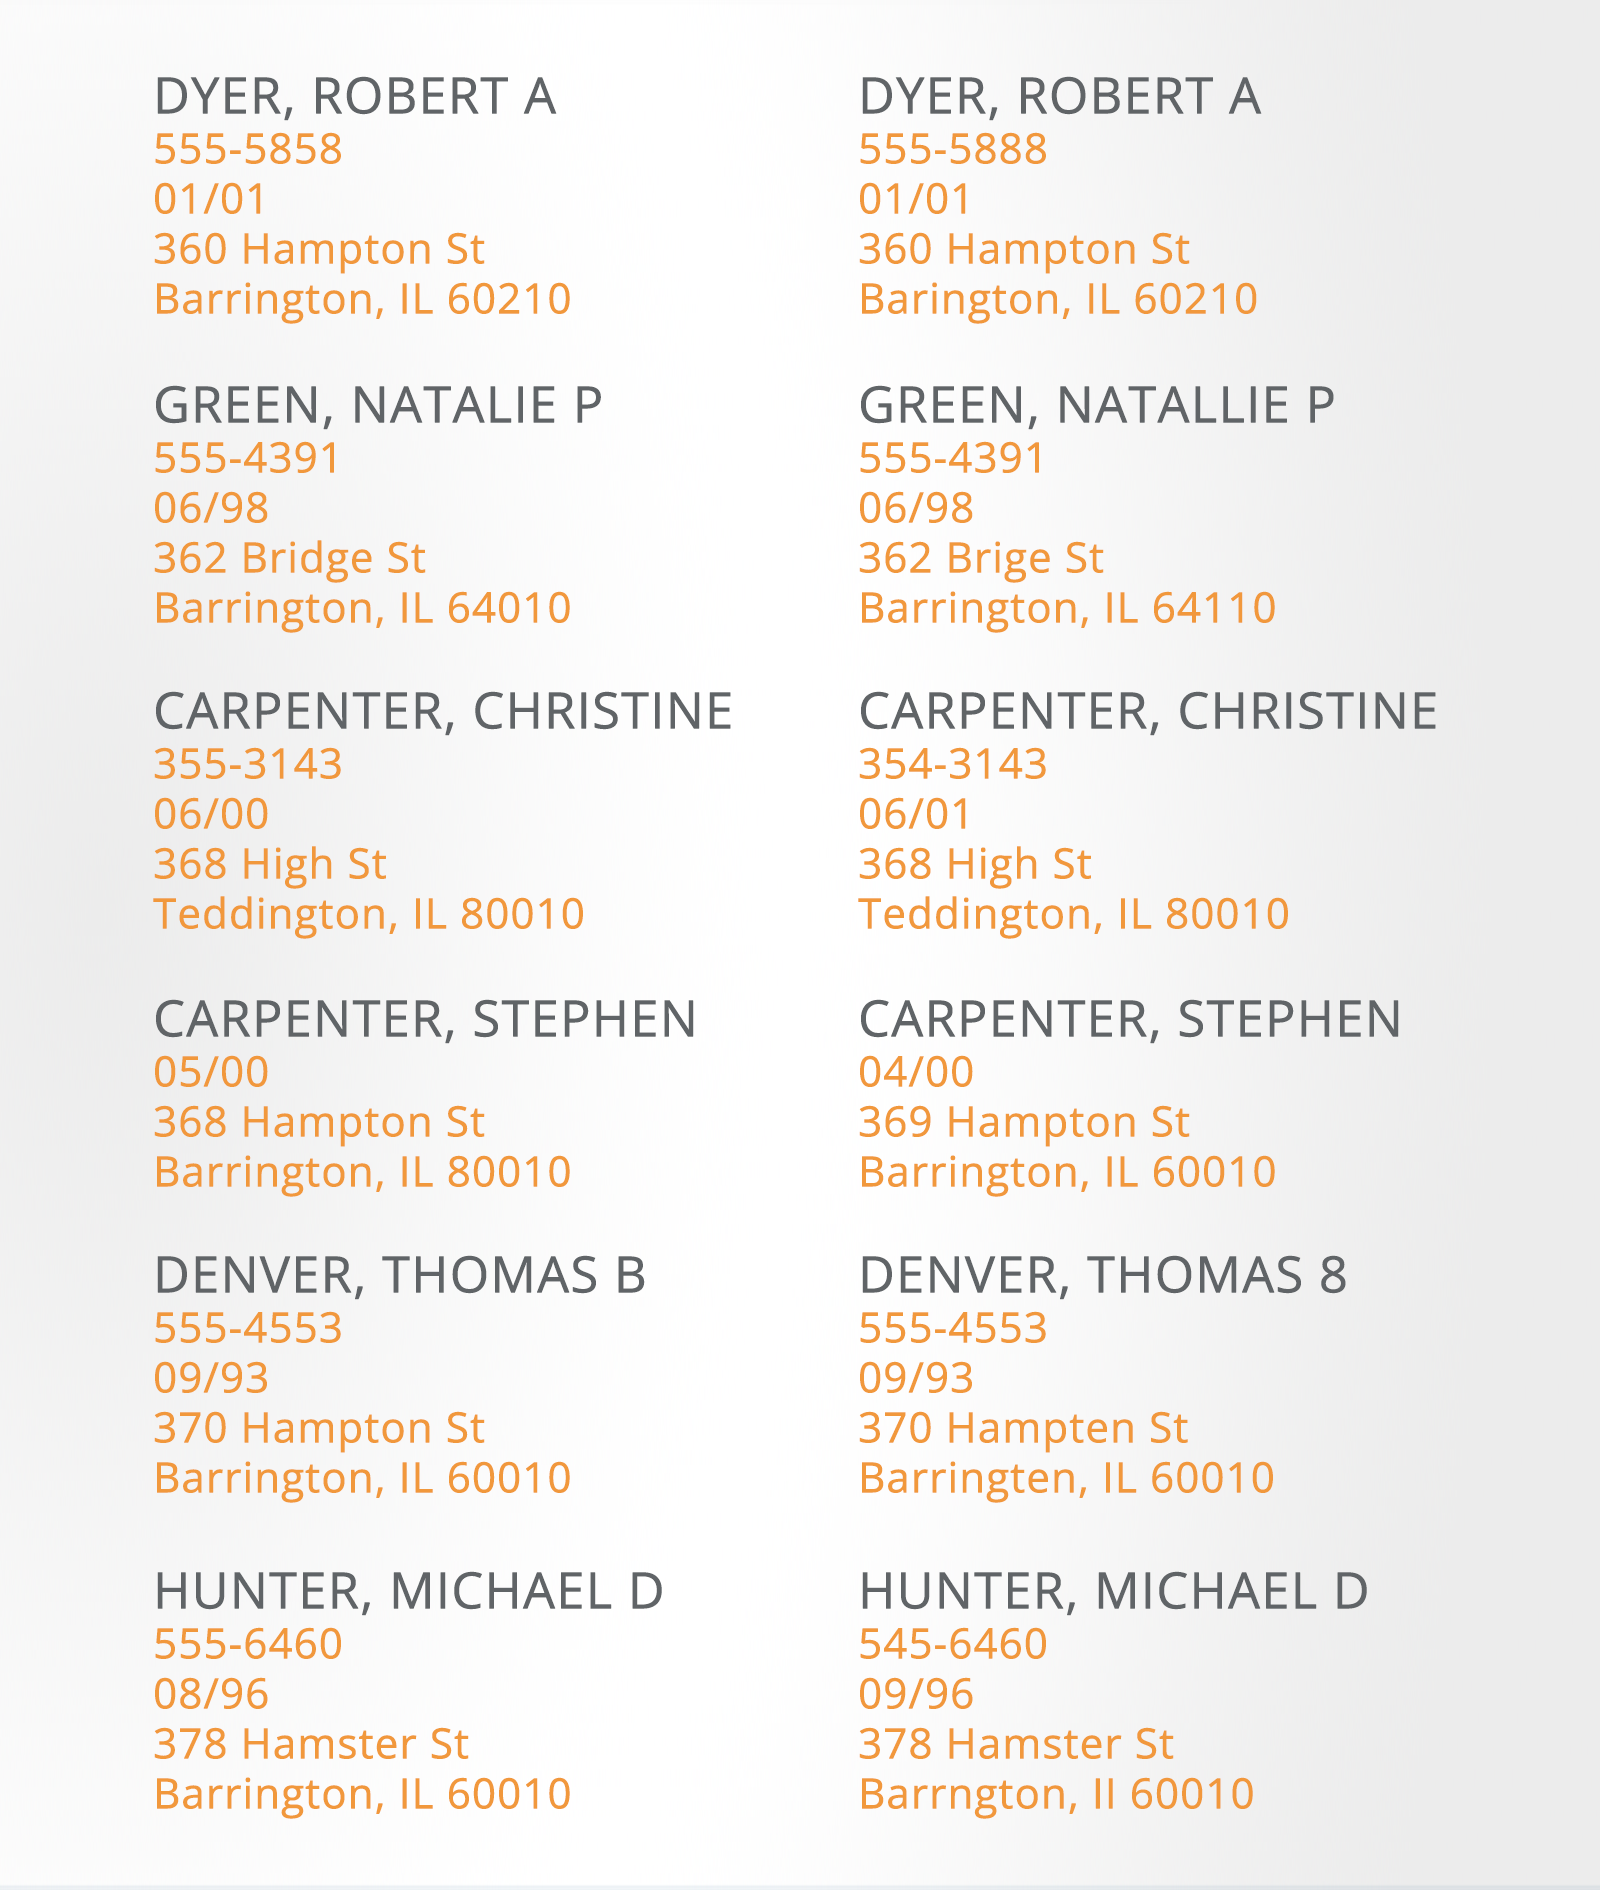
Data Checking
Data checking tests present you with a number of tables of information that must be checked against each other. You will be asked to mark up any differences.
This type of test is used to measure how quickly and accurately you can detect errors in data.

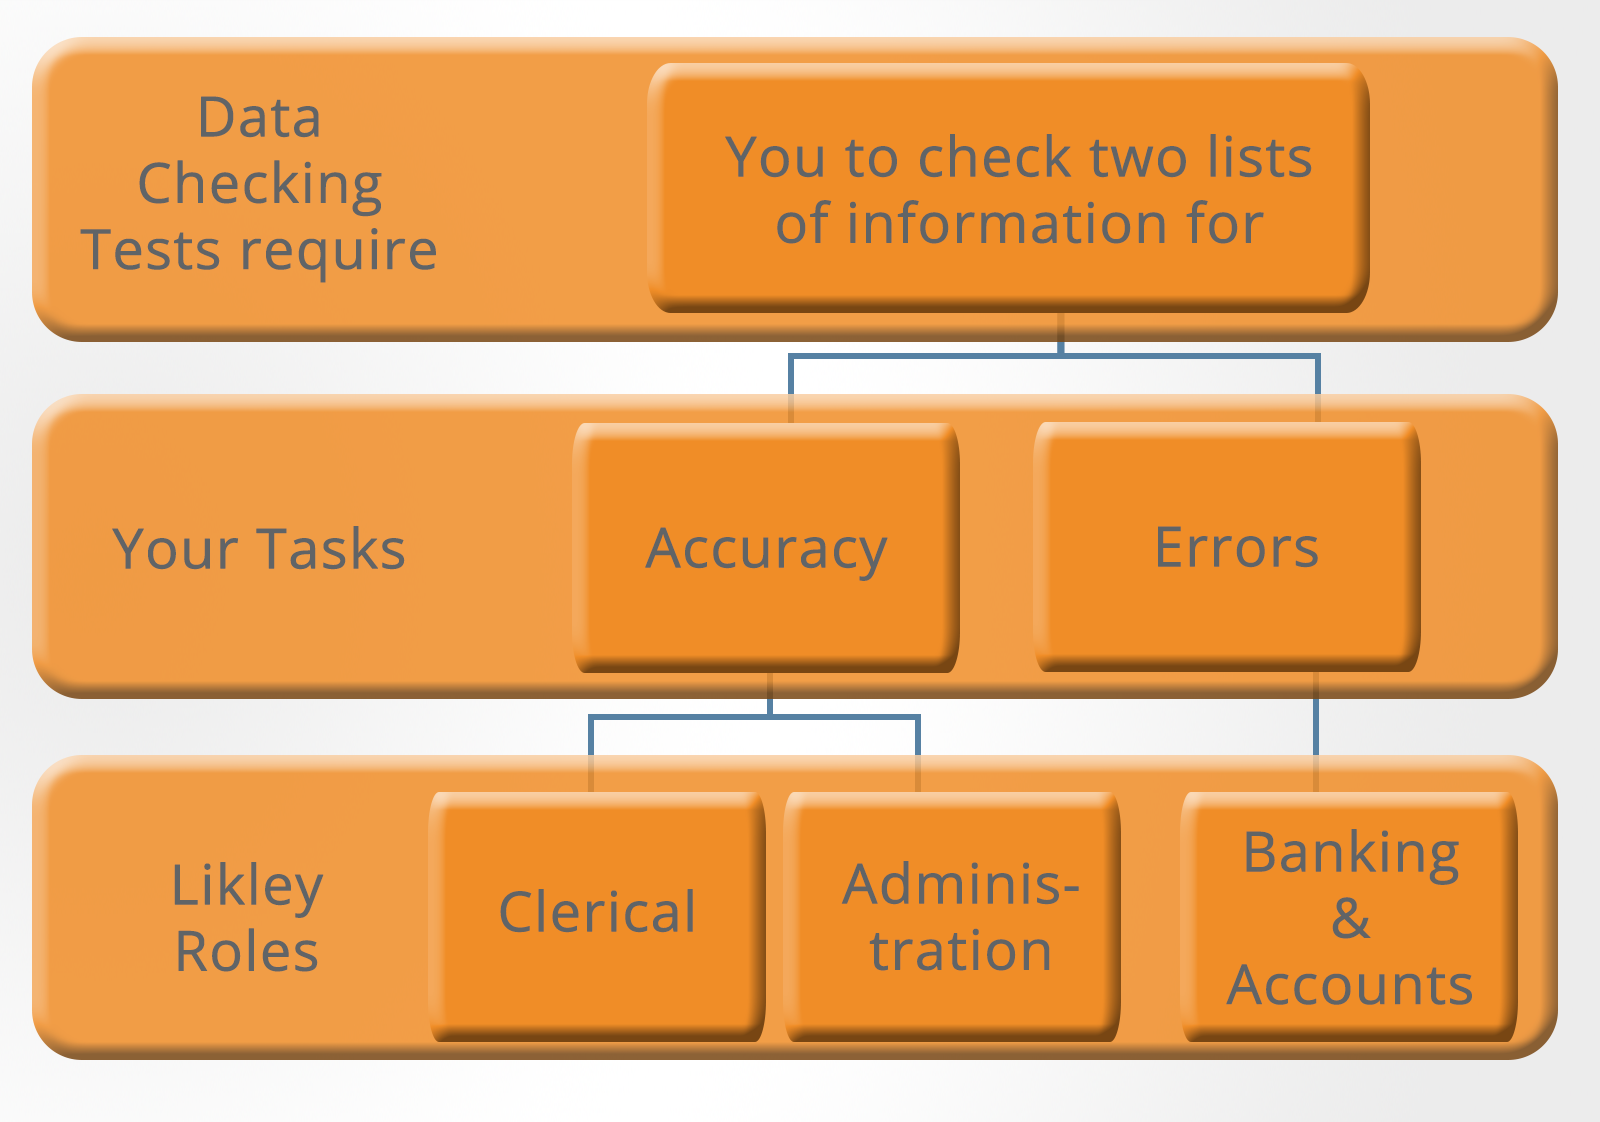
This data may be either meaningless (for example, account numbers) or fairly meaningful (for example, names and addresses).
In both cases, it is vital to carefully check each character rather than read the data normally.
You should also bear in mind that there may be more than one error in any single piece of data.
This test is used to select candidates for clerical and data input jobs, particularly where accuracy is important; for example, accounting and banking.
These tests usually contain between 20 and 40 questions and take 20 to 30 minutes to complete.
It is important, although difficult, to maintain your concentration for the full duration of the test.
1. Check the right-hand column of data against the one on the left and mark any differences with the red marker provided.
Prepare for Any Job Assessment Test with TestHQ
Tips on How to Pass a Numerical Aptitude Test
Many people who have been out of the education system for a while or who don’t use maths on a day-to-day basis, might feel intimidated by numerical aptitude tests.
The important thing to remember is that you don’t need to have studied mathematics to a high level to succeed.
These are primarily tests of basic arithmetic and reasoning ability and the math needed is invariably straightforward.
In all cases, you need to prepare by practicing your mental arithmetic until you are both quick and confident.
Even though you will need to do fewer arithmetic operations in the reasoning tests, there is no point in working out how to arrive at the answer if you make a simple mistake when calculating it.
Your score in the simple speed tests will be very much influenced by your ability to add, subtract, multiply and divide quickly and accurately.
If you are very rusty with arithmetic, try re-learning the times tables up to 12 and practice multiplication and division.
You may also need to get back up to speed with percentages, ratios, proportions, fractions and decimals.
Here are our top tips:
Step 1. Practice Under Timed Conditions
The strict time limit on numerical aptitude tests can make them really tricky.
Make sure you practice working quickly and accurately and always time your practice with a stopwatch.
Try and practice things like your multiplication tables so you can give instant answers. This will help you to feel calm and reduce the pressure you feel when taking the real test.
Step 2. Hone Basic Arithmetic
Numerical reasoning questions won’t usually have a straightforward answer, practice quickly identifying which of your basic arithmetic skills are needed for each question.
Step 3. Try to Work Through Plenty of Practice Questions
Make sure you ask the employer early on what type of questions the test contains. Is it numerical reasoning or does it contain data interpretation, numerical computation or numerical estimation questions? Knowing the answer to this will help you hone your preparation to the correct types of questions.
Numerical reasoning tests are typically scored based on the number of correct answers. Scores are often presented as a percentage or percentile, indicating how well an individual performed compared to a reference group. The scoring may vary depending on the specific test and its format.
Employers commonly administer numerical reasoning tests during recruitment processes. You may encounter them as part of job applications, pre-employment assessments, or academic evaluations. Some testing centers, educational institutions, and online platforms also offer numerical reasoning tests for practice.
A good score on a numerical aptitude test depends on the specific test and its scoring system. Generally, scoring in the top percentile is considered excellent, while scoring at or above the average is also desirable. Employers may have their own benchmarks for what they consider a good score based on the position's requirements.
For many numerical reasoning tests, you can only use basic tools such as a calculator and rough paper during a numerical reasoning test. It's essential to check the test administrator's instructions, as some tests may prohibit specific tools or require you to use provided tools within the test interface.
The difficulty of numerical reasoning questions can vary based on the complexity of the concepts being tested. Some questions may involve basic arithmetic, while others may require more advanced mathematical reasoning. Adequate preparation through practice tests and understanding the test format can help individuals feel more confident when facing numerical questions.
Numerical reasoning practice tests are available online, educational websites and career development resources. Reputable sources that offer practice tests similar to the ones you may encounter in your specific field or industry are recommended for effective preparation. Many websites and testing centers provide free or paid access to numerical reasoning practice materials.
Summary
Numerical aptitude tests are often seen as one of the most tricky aptitude tests you will be asked to take during the recruitment process. However, this is a key skill that will be important to most employers.
With thorough preparation, though, you will be set to impress.
If you would like to try more practice test questions we recommend TestHQ’s practice numerical tests.