The ability to interpret data presented in tables, graphs
and charts is a common requirement in many management and
professional jobs. If you are applying for a job which involves
analysis of or decision-making based on numerical data then you
can expect to have to answer data interpretation questions.

Data interpretation problems usually require two basic steps.
First, you have to read a chart or graph in order to obtain
certain information. Then you have to apply or manipulate the
information in order to obtain an answer. These questions often
use very specific illustrations, for example the question may
present financial data. However, an understanding of finance will
not be needed to answer the question.
These types of question are commonly used in graduate and
managerial selection and you can usually expect 20-25 questions in
20-30 minutes.
Sample Data Interpretation Questions

The table above shows imports for three types of steel over a six
month period. Use this information to answer the following
questions.
|
1 |
Which month showed the largest decrease in total imports over
the previous month? |
|
A |
B |
C |
D |
E |
| |
Feb |
Mar |
Apr |
May |
Jun |
| |
|
|
|
|
|
|
2 |
What was the total value of sheet steel (in $)
imported over the 6 month period? |
| |
A |
B |
C |
D |
E |
| |
56,750 |
75,300 |
55,550 |
42,370 |
44,750 |
| |
|
|
|
|
|
|
3 |
What was the percentage of scrap steel
imported in the 6 month period? |
| |
A |
B |
C |
D |
E |
| |
37.5 |
35.2 |
36.1 |
31.2 |
38.3 |
| |
|
|
|
|
|
|
4 |
What was the difference (in thousands of tons)
between coil steel and sheet steel imports in the first 3
months of the year? |
| |
A |
B |
C |
D |
E |
| |
10 |
16 |
18 |
19 |
20 |
| |
|
|
|
|
|
|
5 |
What was the approximate ratio of sheet steel
and coil steel imports in the first 3 months of the year? |
| |
A |
B |
C |
D |
E |
| |
11:9 |
8:9 |
7:11 |
3:8 |
7:4 |
| |
|
|
|
|
|

The pie charts above show the percentage of students in each
faculty at North West University and the number of non-US students
in the Arts faculty. These percentages have been rounded to the
nearest whole number. There are a total of 1049 students in the
Arts faculty. Use this information to answer the following
questions.
|
6 |
What percentage of students in the Arts faculty are non-US
students? |
|
A |
B |
C |
D |
E |
| |
14% |
9% |
30% |
11% |
15% |
| |
|
|
|
|
|
|
7 |
How many students are there in the Engineering faculty? |
| |
A |
B |
C |
D |
E |
| |
420 |
410 |
390 |
440 |
400 |
| |
|
|
|
|
|
|
8 |
How many students are there at the university? |
| |
A |
B |
C |
D |
E |
| |
4650 |
4560 |
4640 |
4450 |
4460 |
| |
|
|
|
|
|
|
9 |
If six percent of Science students are Asian.
How many Asian students are there studying Science? |
| |
A |
B |
C |
D |
E |
| |
48 |
66 |
120 |
57 |
43 |
| |
|
|
|
|
|
|
10 |
There are 34 European medical students. What
percentage of the faculty does this represent? |
| |
A |
B |
C |
D |
E |
| |
14% |
18% |
12% |
16% |
15% |
| |
|
|
|
|
|
Answer to sample Data Interpretation questions.
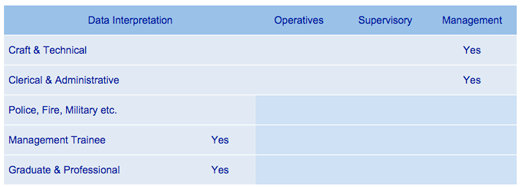
Data Interpretation questions are very widely used to
assessing candidates for graduate and management level jobs.
Many people who have been out of the education system for a
while or who don’t use interpret graphs, pie charts, scatter
diagrams and tables of data on a day-to-day basis may feel
overawed by these types of question. The important thing to
remember is that you don’t need to have studied mathematics to a
high level to succeed. These questions are primarily tests of
interpretation and the math needed is invariably
straightforward.
You will usually be allowed to use a calculator for these types
of question and investing in one which can handle fractions and
percentages is a good idea. You should also try to work through
a few numerical computation practice papers to get back into
swing of these types of calculation.
Download Data Interpretation Questions-Practice
Test 1

Go to psychometric tests
Home Page |